


Oct. 18, 2006
The Notre Dame women’s soccer team – which wraps up its regular season this weekend at Villanova and Georgetown – has sat atop the national polls for most of the 2006 season but the Irish women’s soccer program also currently checks in near the top of the national attendance leaders. Based on a recent sampling of nearly 150 national leaders in home attendance, the Irish women rank third with an average of 2,350 fans in eight games at Alumni Field this season – highlighted by nearly 12,000 over the span of the final two regular-season home weekends (Sept. 29-Oct. 1 and Oct. 6-8). Perennial attendance leader Texas A&M, which will serve as the host site for the 2007 NCAA College Cup championship weekend, leads the way in the recent national sampling with an average home attendance of 3,879 while defending NCAA champion Portland is second at 3,288. Others in the top 10 include BYU (2,249), North Carolina (1,762), Florida State (1,641), Santa Clara (1,589), Florida (1,566), Connecticut (1,369) and Texas Christian (1,255).

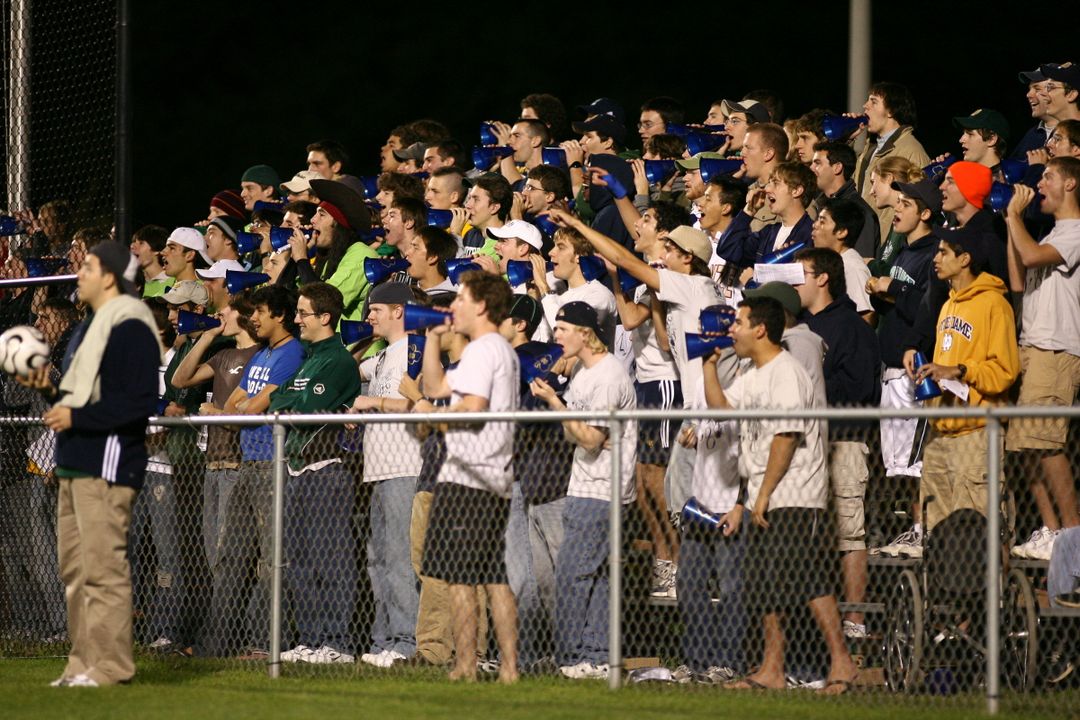
The Irish closed their regular-season home schedule by playing in front of four near-capacity crowds.
|
There currently are 310 schools competing in Division I women’s soccer but official attendance leaders are not announced until after the season. The recent sampling of 146 top teams produced the above leaders and included 14 teams with an average home attendance of 1,000 or higher (others are: Colorado at 1,185; Ohio State’s 1,116; Maryland’s 1,110; and Georgia’s 1,074). The sampling includes teams that meet at least one of the following criteria: among the top-50 attendance leaders in 2005; currently ranked (or receiving votes) in one of the four major national polls or the two regional polls; currently ranked among the top-64 or projected to be in the 64-team NCAA field (per either the Albyn Jones computerized rankings, the most recent NCAA RPI listings, or Top Drawer Soccer’s forecasted NCAA field); or being from one of the nation’s top women’s soccer conferences (ACC, BIG EAST, Big Ten, Big 12, Pac-10, SEC, WCC). The national sampling takes into account games played as of Oct. 15 while using the most recent polls and rankings to help compile the list of teams used in the comparison of the attendance data.
The Irish are on the verge of clinching home field for the BIG EAST Tournament quarterfinal round, with that potential game to be held Oct. 28 or 29 at Alumni Field (look for details on und.com, following this weekend’s games). The BIG EAST Conference – with Notre Dame’s 2,350 average and Connecticut’s 1,369 – joins the ACC and WCC as conferences with two teams among the top-10 of the 2006 attendance sampling list.
Notre Dame finished seventh nationally in 2005 home attendance average at 1,571 – meaning that the current average for ’06 represents a 150-percent boost from the previous season.
Nearly 12,000 fans (11,905) were in attendance at Notre Dame during the final four regular-season home games. It all started with the Sept. 29 showdown versus #6 West Virginia, as 3,056 were on hand for that exciting night. That attendance number technically is the highest in Notre Dame history – as the 1997 ND Adidas Classic had two attendance numbers of 3,330 (announced as sellouts, vs. UNC and Duke), but those numbers included four-game tournament passes (sold to fans of ND, UNC, Duke and UConn) that counted toward the attendance for each game.
Two days after the WVU game, the Irish played in front of 2,681 fans versus Pittsburgh – yielding the highest official attendance for a Sunday game at Alumni Field (2,609 were on hand earlier this season to see ND and Santa Clara in a showdown between #1-ranked teams). A new top number was posted as 3,168 watched the Irish beat Seton Hall on Friday, Oct. 6, followed by another best Sunday crowd of 3,003 for the Oct. 8 game with Rutgers.
The first game of the Randy Waldrum era (a 2-1, double-OT loss to UNC on Sept. 3, 1999) drew 2,957 fans on a Friday night.
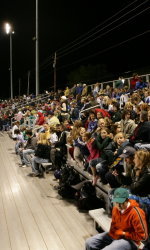
Notre Dame’s average home attendance trails only Texas A&M and Portland in a recent sampling of nearly 150 top Division I programs.
|
Top ND Women’s Soccer Attendance Numbers In Alumni Field History
Fri./Sun. Sept. 19/21, 1997 – *3,300 tickets sold included four-game tournament passes that counted to the attendance number of each game (ND 2, UNC 2; ND 5, Duke)
Friday Oct. 6, 2006 – 3,168 (ND 5, Seton Hall 0)
Friday Sept. 29, 2006 – 3,056 (ND 3, West Virginia 1)
Sunday Oct. 8, 2006 – 3,003 (ND 2, Rutgers 0)
Friday Sept. 3, 1999 – 2,957 (UNC 3, ND 2/2 OT)
Sunday Oct. 1, 2006 – 2,681 (ND 5, Pittsburgh 0)
Sunday Sept. 3, 2006 – 2,609 (ND 3, Santa Clara 1)
Division I Women’s Soccer Attendance Leaders Sampling
(through games as of Oct. 15)
Note that the teams listed below meet at least one of the following criteria: ranked among the top-50 attendance leaders in 2005; currently ranked (or receiving votes) in one of the four major national polls (NSCAA, Soccer Times, Soccer America and Soccer Buzz, or the two regional polls (NSCAA, SB); currently ranked among the top-64 or projected to be in the 64-team NCAA field (per either the Albyn Jones computerized rankings, the most recent NCAA RPI listings, or Top Drawer Soccer‘s forecasted NCAA field); or being from one of the nation’s top women’s soccer conferences (ACC, BIG EAST, Big Ten, Big 12, Pac-10, SEC, WCC).
(1-10)
Texas A&M – 3,879
Portland – 3,288
NOTRE DAME – 2.350
BYU – 2,249
North Carolina – 1,762
Florida State – 1,641
Santa Clara – 1,589
Florida – 1,566
Connecticut – 1,369
Texas Christian – 1,255
(11-20)
Colorado – 1,175
Ohio State – 1,116
Maryland – 1,110
Georgia – 1,074
Illinois – 995
Texas – 992
UCLA – 990
Auburn – 948
Penn State – 945
Yale – 937
(21-30)
New Mexico – 872
Virginia – 872
LSU – 847
Duke – 840
Minnesota – 835
Fresno State – 825
Clemson – 814
Washington – 808
Tennessee – 806
Idaho State – 766
(31-40)
Utah – 755
Creighton – 738
Oregon – 734
Mississippi – 726
Stanford – 706
Kentucky – 698
Charlotte – 695
SMU – 640
Hawaii – 634
Arizona – 626
(41-50)
Missouri – 624
Arizona State – 622
St. Louis – 614
South Carolina – 588
Louisville – 597
Kansas – 589
Oklahoma State – 568
Pacific – 561
Texas Tech – 552
West Virginia – 549
(51-60)
Arkansas – 539
Cal Poly – 537
Kennesaw State – 536
Baylor – 517
Navy – 516
UTEP – 508
San Francisco – 499
Alabama – 491
Wright State – 486
Wake Forest – 483
(61-70)
Cal State Fullerton – 482
Michigan – 470
Washington State – 466
Long Beach State – 446
Marquette – 446
Rutgers – 442
Oklahoma – 435
Rice – 433
Loyola Marymount – 430
Middle Tennessee State – 428
(71-80)
Wisconsin – 425
Indiana – 418
Nebraska – 415
Furman – 413
USC – 408
Dayton – 404
San Diego – 401
California – 399
Villanova – 386
Miami – 381
(81-90)
North Texas – 380
Oregon State – 378
Furman – 377
Mississippi State – 372
South Florida – 365
St. John’s – 355
Syracuse – 355
Samford – 346
Virginia Tech – 342
Gonzaga – 338
(91-100)
Virginia Commonwealth – 336
Brown – 332
Cincinnati – 331
Purdue – 318
Old Dominion – 314
North Carolina State – 311
Iowa State – 309
Dartmouth – 307
Weber State – 306
Wisconsin-Milwaukee – 298
(101-110)
James Madison – 297
Ball State – 295
Boston University – 295
North Carolina-Greensboro – 292
Saint Mary’s (CA) – 292
Lehigh – 266
Columbia – 261
Boston College – 257
Fairfield – 257
Liberty – 251
(111-120)
UC Riverside – 248
Denver – 242
Delaware – 234
Colorado College – 232
DePaul – 230
Central Michigan – 225
Central Florida – 219
Western Kentucky – 217
Siena – 207
William & Mary – 207
(121-130)
Michigan State – 205
Loyola-Chicago – 204
UNC-Wilmington – 200
Northwestern – 200
Pepperdine – 200
Georgetown – 191
Valparaiso – 190
Cal State Northridge – 189
Rhode Island – 188
Coastal Carolina – 187
(131-140)
Fordham – 185
Maine – 184
Iowa – 181
Colgate -177
Providence – 169
Seton Hall – 169
Massachusetts – 165
Pennsylvania – 161
Loyola (MD) – 151
Drake – 145
(141-146)
Monmouth – 143
Pittsburgh – 142
Bucknell – 119
Northeastern – 85
Southeastern Louisiana – 80
Jackson State – 25